Step 1: See It
Report: Custom Report — Career Plan
How to find report:
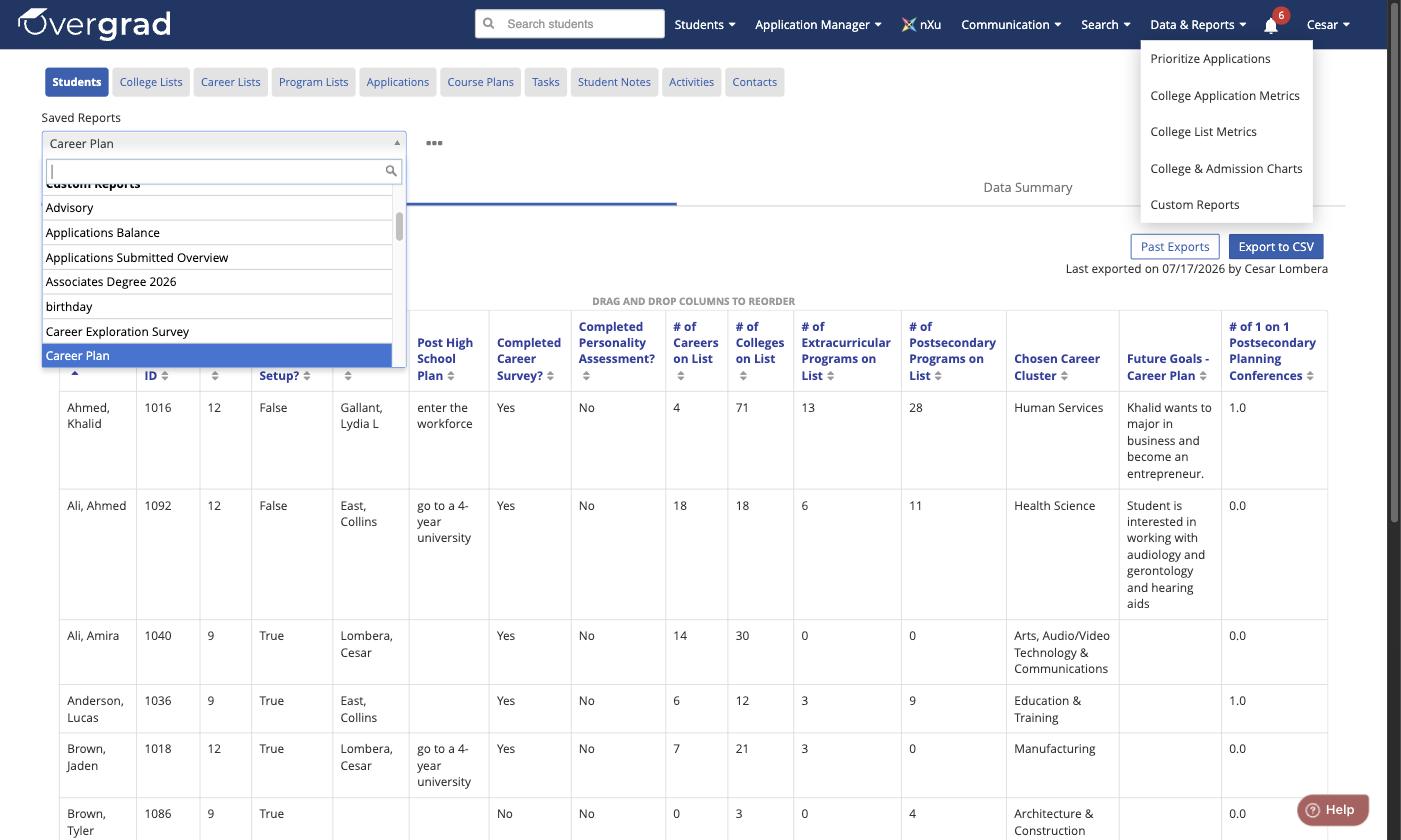
- From any page in Overgrad, click Data & Reports in the top navigation bar.
- Select Custom Reports from the dropdown menu.
- On the Custom Reports page, click the Saved Reports dropdown (it defaults to "All Students").
- Type or scroll to Career Plan under the "Custom Reports" section and select it.
What This Report Helps You See:
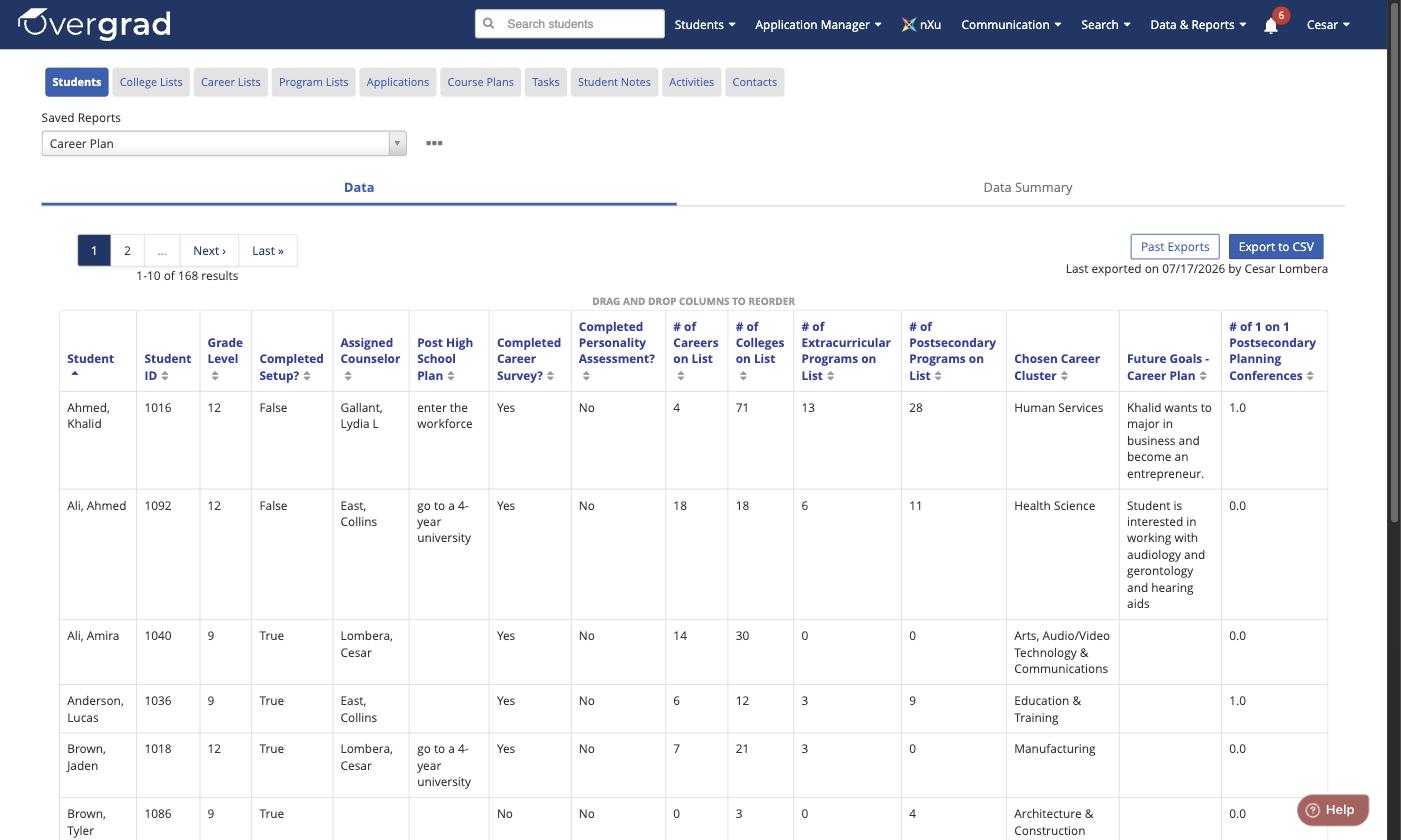
This report surfaces each student's career planning progress in one place: their grade level, assigned counselor, and post-high-school plan, along with whether they've completed their career survey and personality assessment. It also shows how many careers, colleges, extracurricular programs, and postsecondary programs each student has added to their lists, their chosen career cluster, any notes entered under "Future Goals - Career Plan," and their number of one-on-one postsecondary planning conferences.
Step 2: Name It
What to Look For:
Students who haven't completed their career survey or personality assessment, since these are often prerequisites for meaningful career exploration. Students with zero careers, extracurricular programs, or postsecondary programs on their list, who may need outreach or a check-in. Heavy concentration in a small number of career clusters, which could indicate a need for targeted resources, guest speakers, or partnerships tied to those fields. Mismatches between a student's chosen career cluster and their post-high-school plan or college list, which may signal a need for advising conversations. Low numbers of one-on-one postsecondary planning conferences relative to grade level, which may highlight students falling through the cracks.
Data Summary View
In addition to the raw Data table, this report includes a Data Summary tab that aggregates results by subgroup for a quicker, birds-eye view.
How to use it: Click the Data Summary tab (next to "Data") near the top of the report. Use the "View by subgroup" dropdown to group the data by Graduation Year, Assigned Counselor, Gender, Ethnicity, or High School. Click the "+" next to the dropdown to add a second subgroup for cross-tabulation.
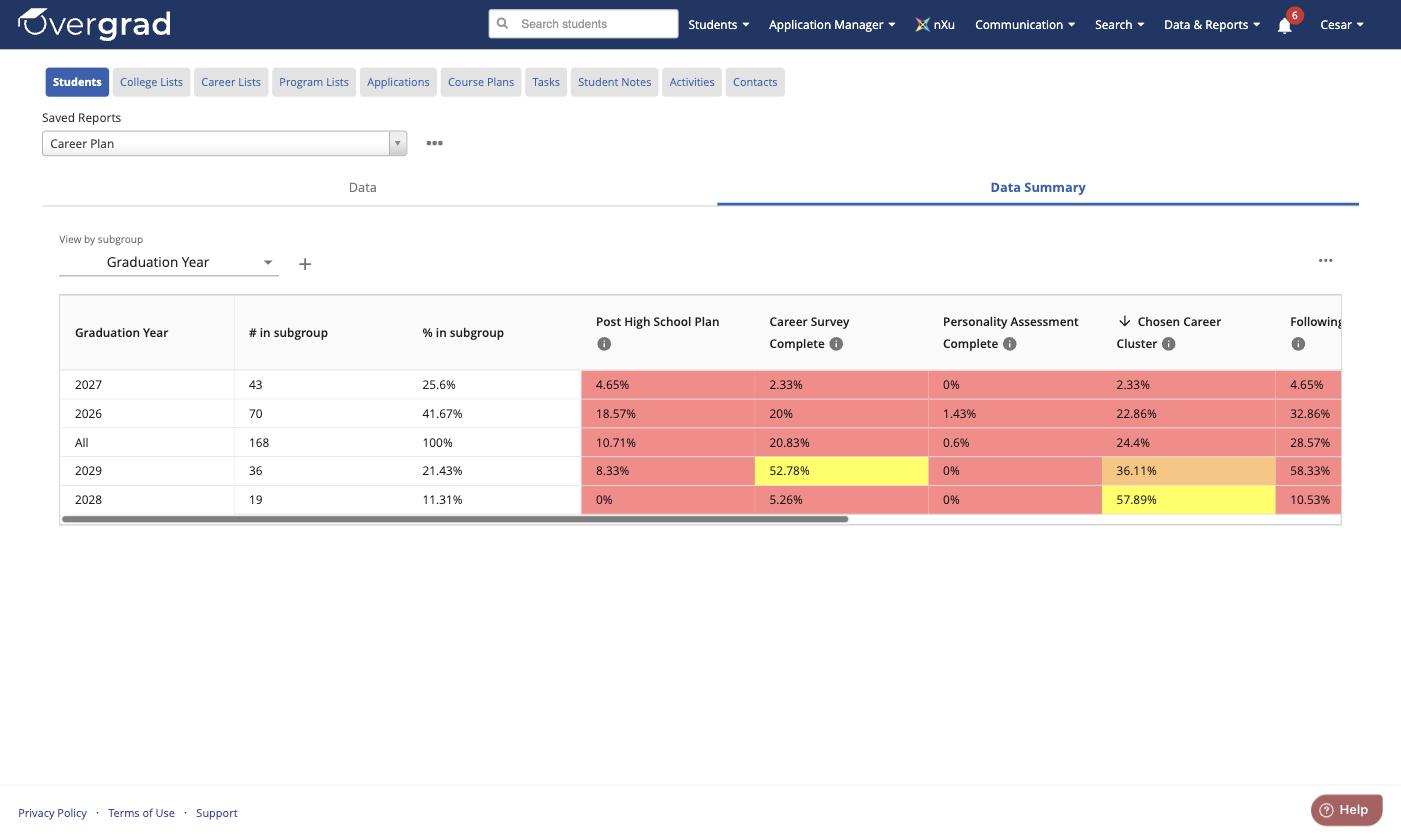
What it shows: For each subgroup (e.g., each graduation year), the summary displays the number and percentage of students in that group, then a series of color-coded percentage columns: Post High School Plan (set), Career Survey Complete, Personality Assessment Complete, Chosen Career Cluster (set), Following 1+ Careers, Following 3+ Careers, Following 1+ Extracurricular, Following 1+ Postsecondary Program, and Notes on Future Goals/Career Plan (entered). Cells are color-coded (red, orange, yellow, green) based on the percentage range, making it easy to visually spot which subgroups are lagging versus on track. Hovering over the small info icon next to any column header shows a tooltip explaining how that field is populated (for example, students edit their career cluster under "My Future > My Careers," while educators edit it via the Careers tab in the student overview) along with the color threshold legend.
Why it's useful: The Data Summary view lets counseling teams quickly compare completion and engagement rates across grade levels, counselors, or demographic groups without manually filtering the full student-level data, helping prioritize which cohorts need outreach first.
Sample Reports with Mock Data Attached Below
Was this article helpful?
That’s Great!
Thank you for your feedback
Sorry! We couldn't be helpful
Thank you for your feedback
Feedback sent
We appreciate your effort and will try to fix the article